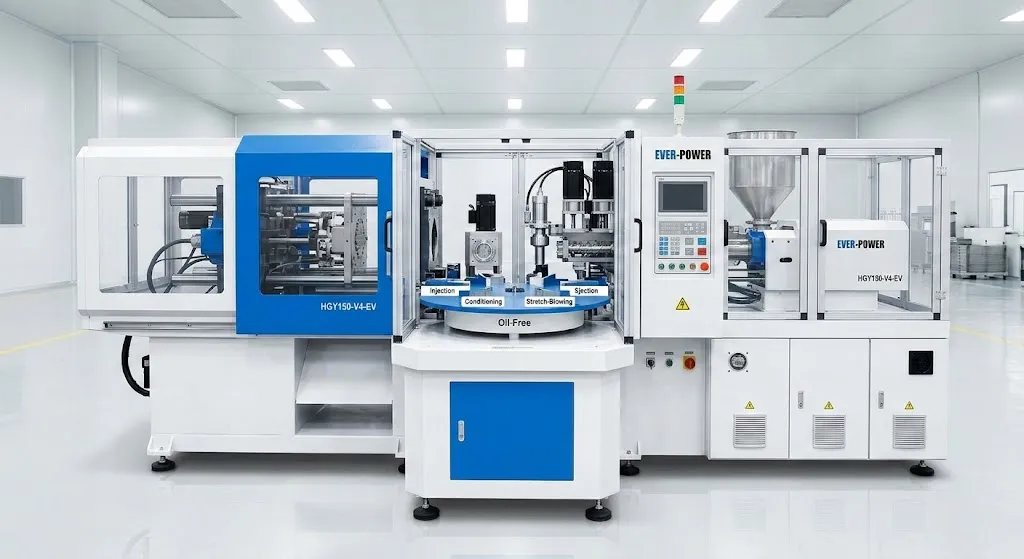
When selecting an injection stretch blow moulding machine, the drive system is one of the most significant decisions you will make — not because of the upfront price difference, but because of what that choice means for your operating costs, process precision, maintenance burden, and production flexibility over a machine lifetime of 15 to 20 years.
The market offers two principal drive architectures: traditional hydraulic systems, which have powered ISBM machines since the technology’s commercial introduction, and modern full servo electric systems, which have become increasingly viable as servo motor costs have fallen and energy prices have risen. Understanding the engineering differences between these two systems — not the marketing language, but the actual mechanical principles — is the foundation of a well-reasoned purchasing decision.
This guide provides a structured technical comparison covering how each system works, where each performs best, what the energy and maintenance cost differences look like in practice, and how to calculate which delivers better return on investment for your specific production context.
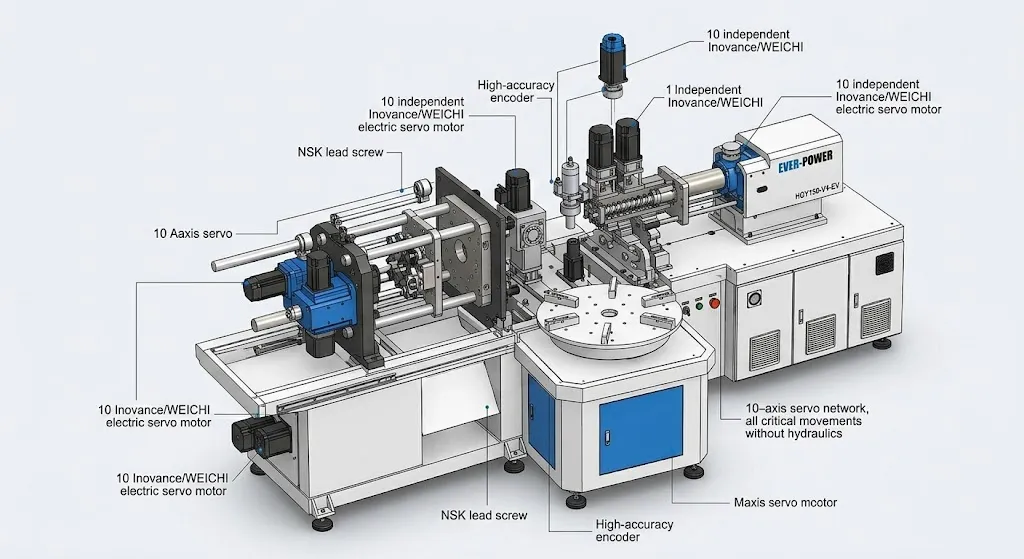
How Each Drive System Works
Understanding the mechanical principles before comparing performance figures
Energy Consumption: The Numbers Behind the 30–40% Saving
Where the energy difference comes from and how it translates into annual operating cost savings
The energy saving figure most commonly cited for servo ISBM machines — 30 to 40 percent versus hydraulic — is not a marketing claim. It derives from a straightforward engineering principle: the hydraulic machine’s pump motor runs at full load continuously, while the servo machine’s motors run only during active movement phases.
In a typical ISBM production cycle for a 250 ml PET cosmetic bottle with an 11-second cycle time, the active movement phases — injection, clamping, stretching, blowing, and ejection — account for approximately 6 to 7 seconds. The remaining 4 to 5 seconds are cooling time during which the servo motors are stationary. This means the servo machine’s drive system is drawing near-zero power for roughly 40 percent of every production cycle.
The hydraulic machine’s pump continues running at constant load throughout the entire cycle, including the cooling phase. This idle energy consumption is pure waste. Over a year of 24/7 production, this waste accumulates to a significant and quantifiable cost, as the calculation below illustrates.
Running 20 hours/day, 300 days/year
Electricity cost: USD 0.15 per kWh
This worked example uses conservative assumptions. In markets with higher electricity costs (Germany: USD 0.35/kWh, Australia: USD 0.25/kWh), the annual saving per machine can exceed USD 30,000 to 50,000.
Positioning Accuracy and Process Repeatability
Why servo drive precision matters for container quality and how it differs from hydraulic positioning
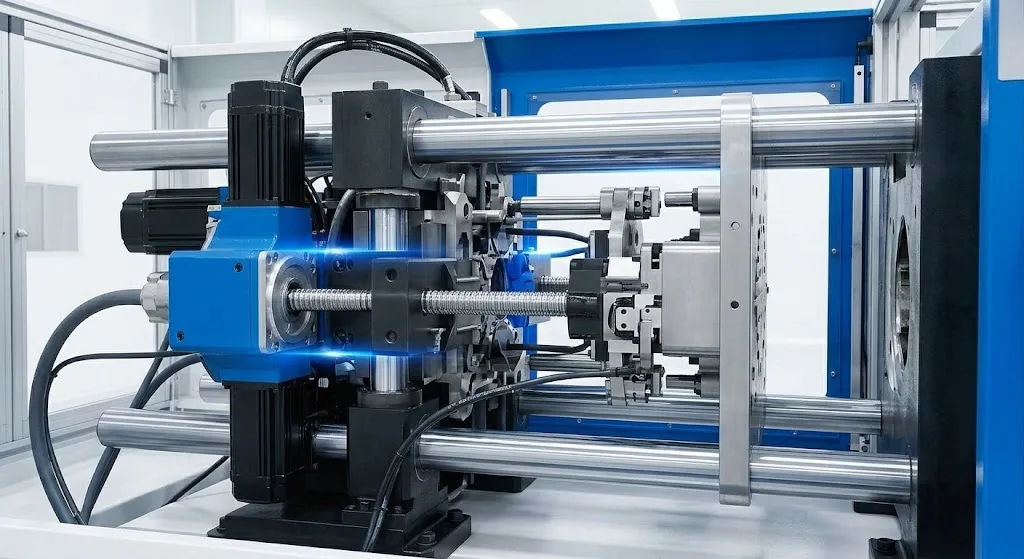
Hydraulic cylinders position themselves through a combination of travel limit switches and pressure feedback. Because the oil is compressible to a small degree and hydraulic seal friction varies with temperature and wear, the actual stopping position of a hydraulic cylinder can vary by 0.1 to 0.5 mm from cycle to cycle. Over a production run of thousands of cycles, this positional variation contributes to variation in preform wall thickness, stretch rod engagement timing, and blow mould closing force — all of which affect container quality.
Electric servo motors driving through precision ball screws position to sub-millimetre accuracy on every cycle. The absolute encoder in each servo motor provides real-time positional feedback to the PLC, which corrects any deviation before the next movement begins. This means the stretch rod always reaches exactly the same depth at exactly the same speed on every shot — a consistency that hydraulic systems cannot match over extended production runs.
The practical consequence of this precision difference is most visible in wall thickness consistency, particularly at the container base and shoulder where stretch rod engagement has the greatest influence on material distribution. Manufacturers who have switched from hydraulic to servo ISBM machines consistently report reductions in wall thickness standard deviation and reductions in container weight variation — both of which translate directly into reduced resin consumption per container and lower scrap rates.
Varies with temperature, seal wear, and oil viscosity changes over production run duration
Absolute encoder feedback ensures identical positioning on every cycle regardless of run duration or temperature
Hydraulic pump and valve noise is a significant factor in factory environments with noise regulations
Electric servo motors and ball screws produce significantly less noise — important for pharmaceutical and food production environments
Maintenance Requirements and Total Uptime
The hidden cost difference that rarely appears in machine purchase comparisons
Hydraulic vs Full Servo: Complete Specification and Cost Comparison
All key differentiators in a single reference table
When Does the Servo Premium Pay Back?
The payback period for the servo machine’s higher upfront cost varies by electricity tariff, production hours, and machine size
The full servo machine typically costs 15 to 30 percent more than an equivalent hydraulic machine at point of purchase. This premium is real and must be justified by operational savings. The calculation is straightforward: the annual energy and maintenance saving from the servo machine divided into the acquisition cost premium gives the payback period.
Using the energy saving example from earlier in this article (USD 14,175 per year at USD 0.15/kWh) plus maintenance savings (USD 2,000 per year in oil and seal costs), the total annual saving is approximately USD 16,175. If the servo machine costs USD 30,000 more than the hydraulic equivalent, the payback period is approximately 22 months.
In markets with higher electricity costs, payback periods are significantly shorter. A German manufacturer paying USD 0.35 per kWh would realise approximately USD 33,000 in annual energy savings alone, yielding a payback period under 12 months for the same USD 30,000 acquisition premium. Over a machine lifetime of 15 years, the total saving in such a scenario exceeds USD 500,000 per machine.
Which Drive System Is Right for Your Production?
A practical framework for matching drive system architecture to production requirements
Calculate Your ROI With Our Engineering Team
Tell us your current electricity tariff, planned production hours, and container type. Our engineers will produce a personalised ROI analysis comparing servo and hydraulic options for your specific scenario — at no charge and within 48 hours.
Frequently Asked Questions
Energy consumption figures are based on standard factory test comparisons between comparable hydraulic and servo ISBM machines under controlled production conditions. Payback period calculations use conservative assumptions; actual results vary by electricity tariff, production hours, and machine configuration. For a personalised analysis, contact [email protected] or visit our contact page.